Semi Automated Vector to Image Conflation Software
ImVecTool
Semi Automated Vector to Image Conflation
ImVecTool is a workstation software application created to provide the capability of semi-automated vector to image conflation. Dramatic reductions in the time required to
conflate vector data to imagery have been realized in the DoD Community. The time required to conflate a one nautical mile by one nautical mile target area was reduced from
40 hours to one hour. Similarly time required to conflate a six nautical mile by six nautical mile surrounding area was reduced from 120 hours to 6 hours while the time
required for a 30 nautical mile by 30 nautical mile perimeter area was reduced from 400 hours to 40 hours.
For questions about ImVecTool not answered on this page or request a demonstration feel free to contact us here.
The algorithmic approach used in this application centers on using the transportation network to define a set of mapping controls that are then applied to all layers of the
feature data set. The approach uses standard image correlation algorithm to automatically locate transportation layer features in the imagery by projecting what the feature
would visibly appear as into an image and correlating the projection against the actual image. Textures used for the projection can either be operator specified based on
feature type or if only fine tuning of a feature dataset which is very close geometrically to the image base it is being conflated to, textures can be automatically generated.
The location of the vector projection into the image is varied pixel by pixel across a targeted search area. The search area must always be larger than the target area. The
point at which the highest image to image correlation value is reached during the search becomes the predicted location of the feature if certain criteria is met. Concurrent
to the evaluation of correlation, the image data that falls under the mask of the projected vector is analyzed for having a general uniformity.(I.E. Pixels along a transportation
surface generally tend to have very similar radiance and chrominance values) This relationship is referred to as “flatness” within the application. The location of highest
uniformity with pixels under the vector projection is recorded for the search. Both correlation values and uniformity values range from 0.0 to 1.0 with 1.0 representing an
absolute match. Overall confidence in the determined location is achieved by analyzing the magnitude of correlation and uniformity values as well as agreement in the geographic
location of where the highest values occur. (I.E. if correlation is high and uniformity is high and both point to the same location, then high confidence is achieved that the
correct conflated position has been found. Confidence values range from 0.0 to 10.0 and only locations with confidence values greater than the specified minimum confidence are
used as control in the solution. In the application of this algorithm it was found that occasional occurrences of high confidence in a predicted location that is incorrect can
be refined by applying a threshold and average approach to the correlation and uniformity values. Thus the process as applied uses a percentage threshold for both correlation
and uniformity and averages the positional locations of values meeting the threshold to determine the final predicted position of the feature within the image base. Feature
locations that are determined through this process to have confidence values greater than the specified minimum confidence value become the control information for the entire
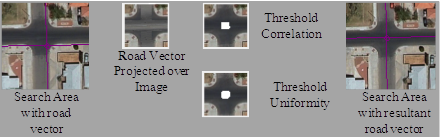
data set. In addition any operator specified corrections are added to the control network. The image below shows an example of the basic approach. For the given vertex which is
a road intersection the image chip on the left labeled “Search Area with road vector” shows the search area to be processed by the correlation process along with the input vector
location. To the right of this image we see the target area search image with vector projected into the image as an image texture at the point of maximum correlation. To the right
of this image we see the final target area with points that meet the threshold values for both correlation and uniformity marked as white pixels. After these threshold positions
are averaged the image on the right shows the resultant vertex location of the road intersection. The application includes GPU acceleration of the correlation process when an
appropriate GPU and driver are available. (NVIDIA with CUDA)
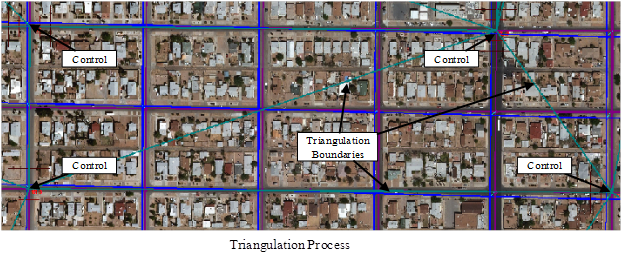
The control network is used to define a Delaney triangular mesh. All vertex locations in the dataset that are not part of the control set fall within a triangle of this triangular
set. For each triangle in the set an affine matrix is derived based on the control vertices original location and its mapped location. All vertices in the dataset that are not
controlled are processed through the matrix of the triangle for which they fall within. The operator of the tool may select any vertex in the dataset and manually specify its
conflated position in the output. Such points by default become part of the control set and non-controlled points are dynamically mapped around them. Implementation of using this
triangulation mapping approach yields the result of having a dramatic reduction in the number of mouse clicks required to conflate a dataset even when the imagery base is not
conducive to the auto correlation techniques. (I.E. Low contrast single band imagery) The image below shows a visual depiction of the process with control points labeled. Blue
lines represent input source vectors while dark magenta represent the conflated positions. The dark cyan lines represent the lines of triangulation. Regions within a data set
can be defined that allow multiple control meshes for a given data set.